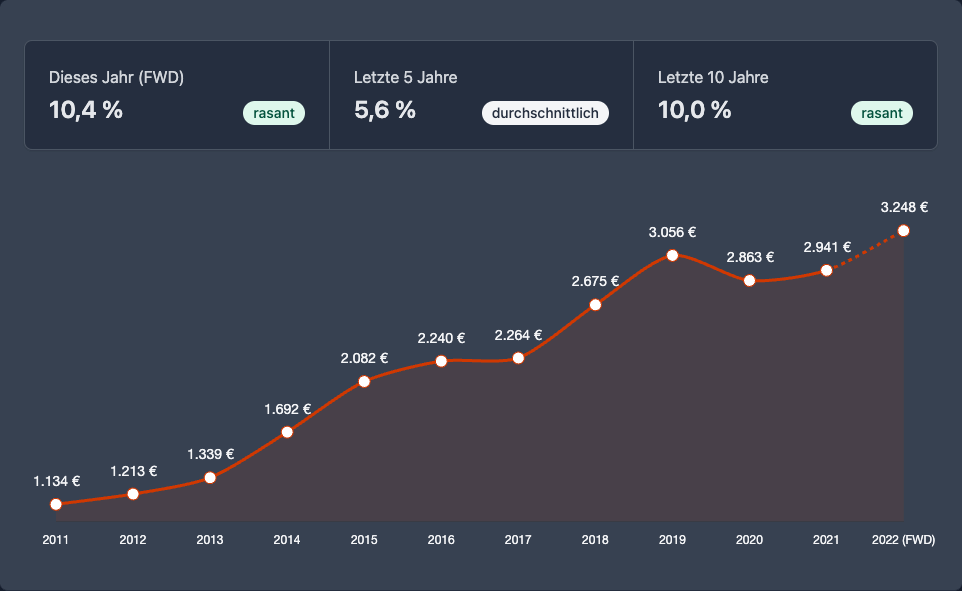
Dividend Growth (CAGR) for your portfolio
As an "aristocrat", you can always keep an eye on the annual growth of your dividends with our new chart.
With our new chart of your annual dividend growth (CAGR) for your portfolio, you can visualize the development of your annual dividend income (either gross or net) in a backtest* and optimize it for the future.
Backtest: assuming your portfolio has not changed in the last years.

You can find the new chart at the end of the dividend tab in your portfolio.
If you are not yet an aristocrat, you can also test the new chart in our Live Demo Portfolio.
Further good dividend yields wish you
Max & Johannes