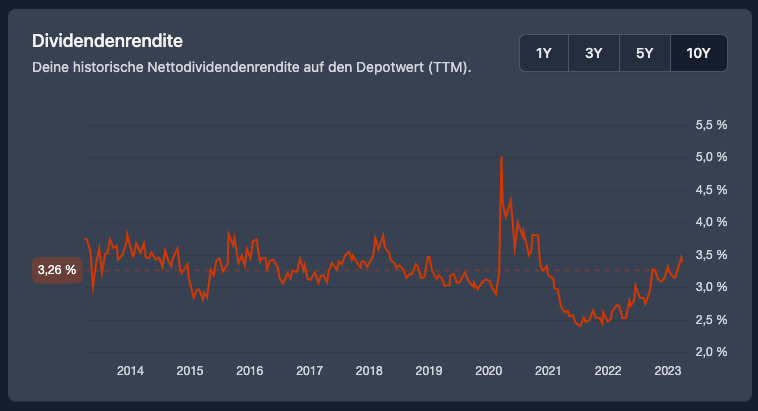
Historical dividend yield for your portfolio
Your historical dividend yield on the portfolio value (TTM) over time
From now on you have the possibility to view your historical dividend yield on the portfolio value (TTM) over the last 10 years.
The new line chart shows how your dividend yield for your entire portfolio has developed over time, assuming you had not changed your portfolio holdings (backtesting).

You can find the new chart in the Dividend Tab of your portfolio.
This feature is exclusively available for our Aristocrat members, who enable the active development of DivvyDiary by their support.
If you are not yet an Aristocrat, you can also test the new evaluation in our Live Demo Portfolio.
Further good dividend yields wish you
Max & Johannes