More evaluations for historical dividends
Dividend allocation for all historical years and months incl. consideration of the purchase date.
In the last two months, we have received an increasing number of requests from the community for us to take the transaction history per security into account in our allocation chart for your own dividend.
We have complied with this request and have created more detailed dividend evaluation options for you.
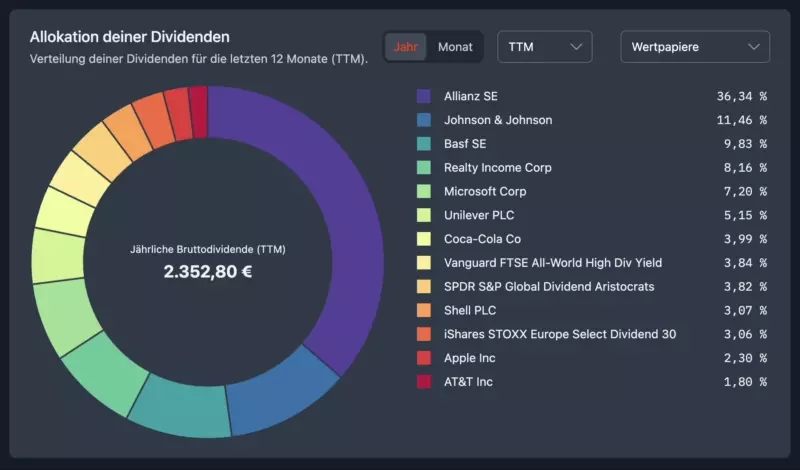
You can now view the dividend allocation per year or month and see how it has changed over time.
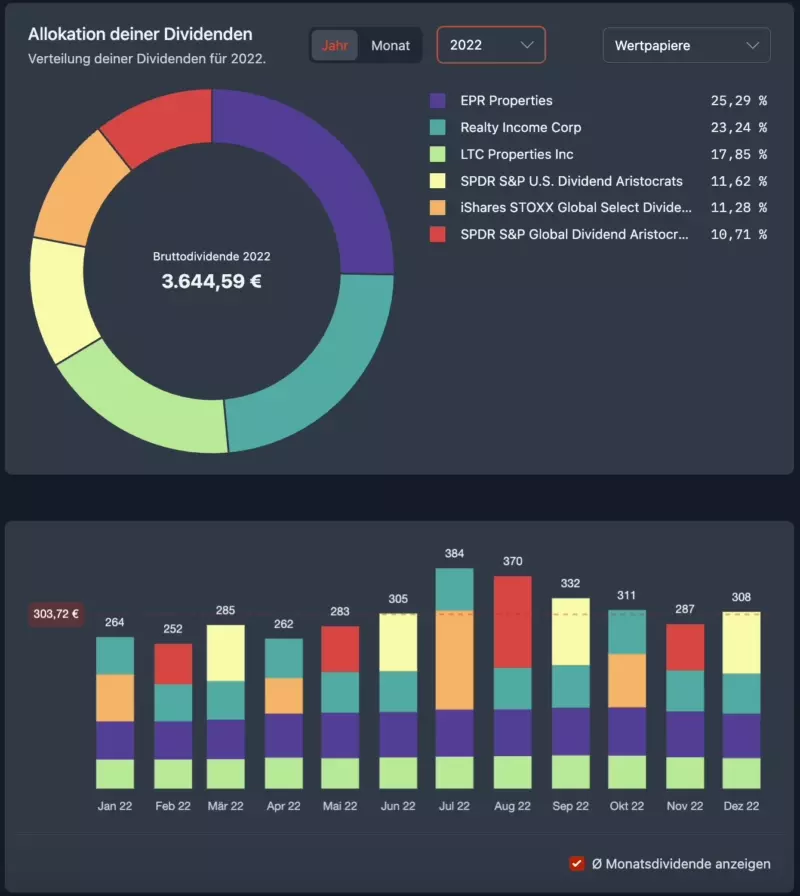
In addition, when selecting a historical year, we also show the dividend allocation within the year,
For the monthly view, this chart is currently still disappearing. However, we are planning to convert it for the monthly view as well, so that you will soon be able to compare the current month with the previous year's months at a glance.
As attentive users will have noticed, the two charts are no longer to be found under the item Analysis in the portfolio, but under the tab Dividends, as they now take the transaction history into account and thus depict the development of your dividends historically accurate.
Last but not least, we have added a monthly view to the Dividend Matrix. Here you can already see the dividend comparison to the previous year's months (chart follows).
We hope you like the new, more detailed evaluation options.
You can also test the new analysis in our Live Demo Portfolio.
We wish you further good dividend yields
Max & Johannes