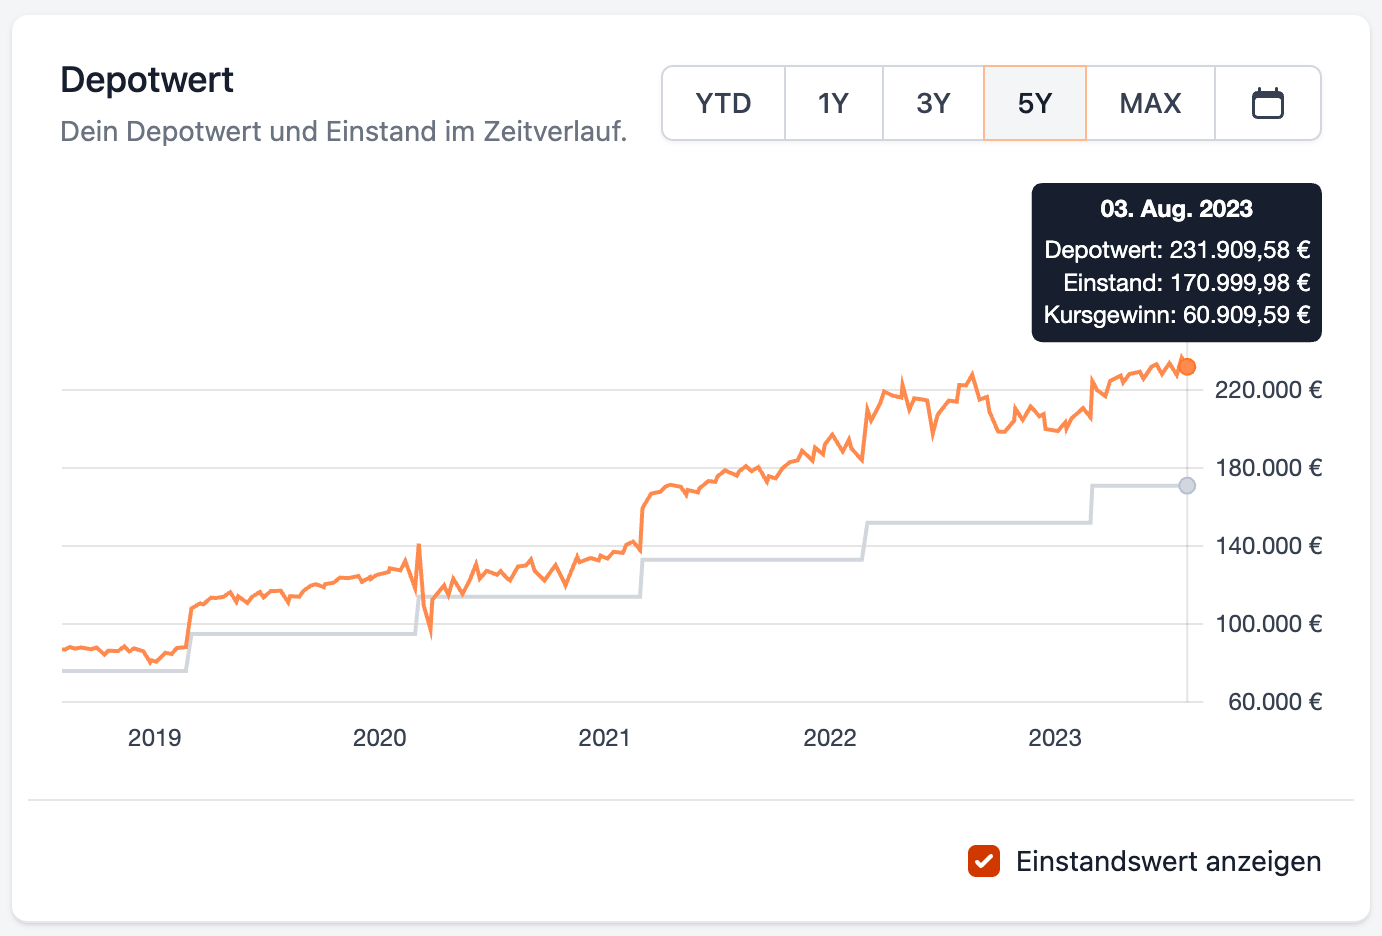
Depot value over time
Your portfolio value, buy-in and price gain over time.
In the Analysis tab of your portfolio you will now find a new chart for the evaluation of your portfolio value over time.

If you wish, you can display your cost value and your price gain. In this way, you have an overview of the price performance of your portfolio at all times.
You can freely set the analysis timeframe (start date and end date).
The chart takes into account your buy and sell history (transactions), if you have maintained it.
You can also test the new chart in our Live Demo Portfolio.
We wish you further good dividend yields
Max & Johannes