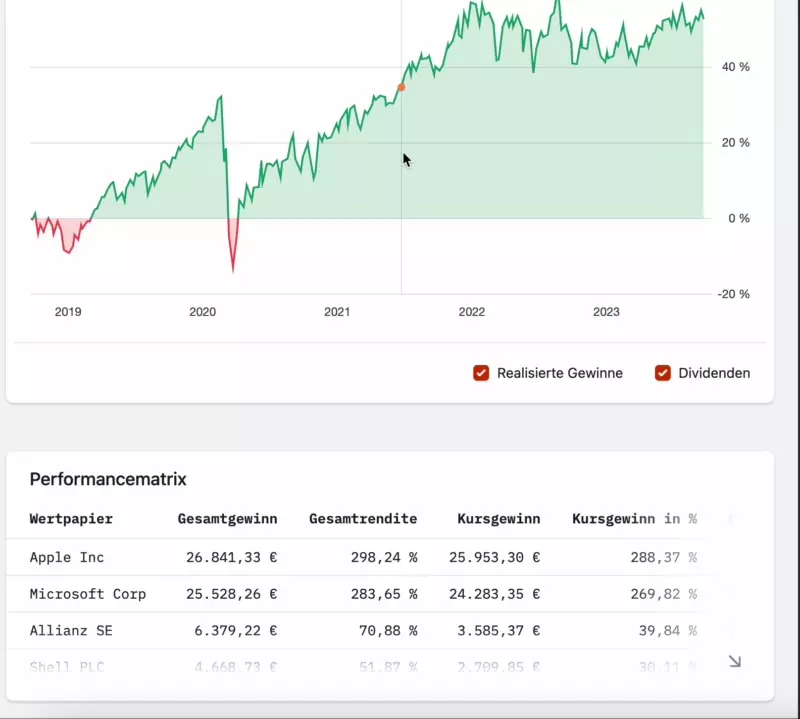
Performance matrix
Your personal total return per security.
In the Analysis tab of your portfolio, you can view the total return per security in any desired timeframe in our new performance matrix.

In addition to the total return, you can also see the price gain, the dividends received and your realised gains and losses per security.
You can freely select the timeframe, e.g. to view your winners and losers since purchase (MAX), in the current year (YTD) or in 2022 (🗓️).
The performance matrix takes into account your buy and sell history (transactions) if you have maintained it.
You can also test the performance matrix in our Live Demo Portfolio.
We hope you like the new features.
We wish you further good dividend yields
Max & Johannes